What does it mean for a sample to be "overloaded"? When a sample is said to be "overloaded," that...
Unfortunately, not every particulate matter (PM) sample that you attempt to collect will be successful. After collecting a sample, you will need to perform quality assurance (QA) checks to determine whether that sample resulted in a usable measurement. The criteria you use to determine whether a sample was successful will depend on your unique study design, sampling protocol, and/or measurement goals; however, the general questions that you should ask when performing quality assurance on a sample are listed below. Click on the links in the list for advice on answering each question.
- Did the sample run for the target duration?
- Was air sampled at the target volumetric flow rate?
- Did you collect enough particulate matter? In other words, was the amount of PM sampled onto the filter above your limit of detection (LOD)?
- Did you collect too much particulate matter? In other words, was the sample filter overloaded?
- Optional: How did the filter-derived PM2.5 concentration compare to the sample-averaged sensor-reported PM2.5 concentration?
Did the sample run for the target duration?
You probably had a target duration that you wanted each sample in your study to run for, like 24 or 48 hours. Unfortunately, your sample might have stopped before the target duration was reached because the battery in the sampler died, the sampler overheated, the inlet became blocked, or the sample filter got overloaded.
To see how long your sample ran, check the SAMPLE SUMMARY section in your log file header. The parameter names that indicate the overall sample duration in log file headers written by different Access Sensor Technologies (AST) instruments are listed in Table 1. If the sample stopped before the target duration was reached, you can look at the ShutdownMode parameter (in the same SAMPLE SUMMARY section of the log file header) to find the reason why the sample stopped early.
Table 1. Parameter names from log file headers indicting the duration, in hours, for which the sample ran.
| Device | Parameter name(s) |
| UPAS v2.0 | SampledRuntime |
| UPAS v2.1 or v2.1 PLUS | OverallDuration |
| Home Health Box |
D.SorbentSampledRunTime
C.SorbentSampledRunTime
A.FilterSampledRunTime
B.FilterSampledRunTime
|
You will need to decide: How close must the actual sample duration be to the target sample duration before you accept a sample? In other words, how close must the actual duration be to the target duration for the sample to be considered representative of the exposure in question and comparable to other samples from the study?
Some sample duration-related quality assurance criteria used in existing sampling protocols and prior studies are summarized below as examples:
-
The United States Environmental Protection Agency (US EPA) Federal Reference Method (FRM) for collecting outdoor PM2.5 samples specifies the target sample duration as 24 hours. The protocol specifies that the actual sample duration should be between 23 and 25 hours.
-
Burrowes et al. (2020) established a target duration of 24 hours for indoor and personal PM2.5 samples collected during the HAPIN trial. They only accepted samples that ran for at least 23 hours (which was 96% of the target duration).
- Li et al. (2025) established a target duration of 24 hours for indoor and personal PM2.5 and PM10 samples collected in California. They accepted samples that ran for within 4 hours of the target duration. In other words, they accepted any sample that ran for between 20 and 28 hours.
- Shupler et al. (2020) established a target duration of 48 hours for indoor and personal PM2.5 samples collected during the PURE-AIR study. During their sample quality assurance process, they flagged samples that ran for less than 43 hours (which was 90% of the target duration).
- Tanner et al. (2025) established a target duration of 48 hours for personal PM2.5 samples. They accepted samples than ran for at least 36 hours (which was 75% of the target duration). You can read their publication to learn more about the data-driven procedure they used to select 36 hours as the minimum acceptable sample duration.
Was air sampled at the target volumetric flow rate?
PM samples are usually collected using inlets that are designed to only allow particles smaller than a specific size to reach the filter. These "size-selective" inlets allow a particle smaller than the intended size to pass through the inlet (or prevent a particle larger than the intended size from passing through the inlet) based on that particle's inertia. For that reason, a size-selective PM sampling inlet is designed to operate at a specific volumetric air flow rate (for example, 1 L min-1 or 2 L min-1). It's important for a sample pump to pull air through a size-selective inlet at the volumetric flow rate for which the inlet was designed. If air flows through the inlet at the wrong volumetric flow rate, the inlet will sample the wrong PM size fraction. For example, if a size-selective inlet was designed to sample PM2.5 at a flow rate of 1 L min-1, but air is sampled through the inlet at 0.7 L min-1 instead, the inlet will sample particles larger than 2.5 μm. For that reason, it's important to confirm, during your sample quality assurance process, that air was sampled at the target volumetric flow rate for the full duration of the sample.
You will need to decide: How close must the actual sample volumetric flow rate remain to the target flow rate for the sample to be accepted?
The United States Environmental Protection Agency (US EPA) Federal Reference Method (FRM) for collecting outdoor PM2.5 samples specifies that the volumetric flow rate, when averaged over ≤5 minutes, must remain within 5% of the target value for the full duration of the sample.
Every air sampler sold by AST includes an active flow control system that is designed to maintain the sample volumetric flow rate within 4% of the target value for the duration of the sample. The sampler will measure the air sample flow rate and adjust the pump power level, as needed, during the sample to maintain the target volumetric flow rate even if the air density or the pressure drop across the sample filter changes. Because each AST air sampler is equipped with active sample flow control, we think it's unlikely that you will find that your UPAS or Home Health Box is not sampling air at the correct volumetric flow rate, unless the device is broken, the inlet and filter cartridge are not installed correctly, the inlet is blocked, or the sample filter is overloaded and clogged.
There are a few ways that you can confirm that the volumetric flow rate of your air sample remained close enough to the flow rate for which your size-selective inlet was designed.
-
Parameters related to the sample volumetric flow rate that are written to the log file by AST instruments are summarized in Table 2. You can compare the data associated with these parameters in the sample log file to the target flow rate.
- You can graph the volumetric flow rate data from the SAMPLE LOG over the duration of the sample using our R Shiny application or other software of your choosing. See the example shown in Figure 1.
- You can measure the filter sample volumetric flow rate using an external flow rate meter before starting each sample and record the flow rate that you measure. We recommend using the Alicat MWB-5SLPM-D or MW-5SLM-D flow meter with AST samplers. If you find that the UPAS sample flow rate differs from the target value during the process, you can adjust the sample flow rate using the "Filter Flow Check & Adjust" feature in the AST UPAS app (for the UPAS v2.1 or v2.1 PLUS) or the "Flow Offset" feature in the UPAS app (for the UPAS v2.0). Read the User Guide for your UPAS and watch this YouTube video for additional guidance on this process.
Table 2. Parameter names from SAMPLE SUMMARY and SAMPLE LOG sections of log files that indicate sample flow rates. The SAMPLE SUMMARY section appears in the log file header. Each of these parameters is logged in units of L min-1. Parameters written to the SAMPLE SUMMARY are averaged over the full duration of the sample. Variables written to the SAMPLE LOG are, typically, written every 30 seconds during the sample and averaged over each 30-s interval.
| Sampler | Firmware version | Log file section |
Parameter
|
Description
|
| UPAS v2.0 | Any |
SAMPLE SUMMARY
|
AverageVolumetricFlowRate
|
|
| 100 | SAMPLE LOG |
VolFlow
|
Sample volumetric flow rate
|
|
| >100 |
VolumetricFlowRate
|
|||
| UPAS v2.1 or v2.1 PLUS
|
<200 |
SAMPLE SUMMARY
|
PumpingFlowRateAverage
|
|
| SAMPLE LOG |
PumpingFlowRate
|
|
||
| ≥200 |
SAMPLE SUMMARY
|
|
|
|
|
PumpingFlowAvgOffset
|
|
|||
|
SAMPLE LOG
|
|
|
||
| PumpingFlowOffset | ||||
| Home Health Box | Any | SAMPLE SUMMARY | A.FilterAverageVolumetricFlowRate | |
| B.FilterAverageVolumetricFlowRate | ||||
| SAMPLE LOG | A.VolFlow | Filter Channel A: Volumetric air flow rate through the sample filter | ||
| B.VolFlow | Filter Channel B: Volumetric air flow rate through the sample filter |
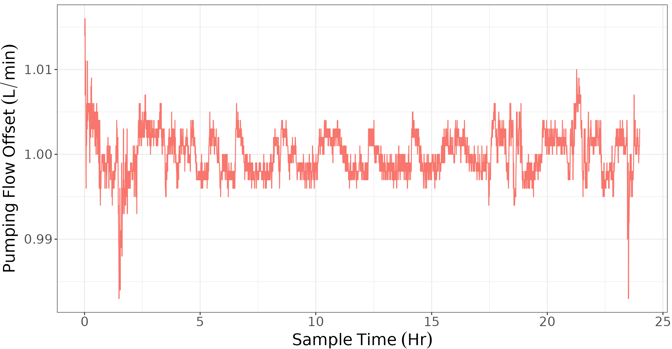
Figure 1. A graph of 30-s-average sample volumetric flow rates logged by a UPAS over the duration of a 24-h sample. This graph was created using the "Interactive Plot" tab in the shinyAST application. In this example, the sample volumetric flow rate remained at the target value of 1 L min-1 ± 4% over the full duration of the sample.
Did you collect enough particulate matter?
Was the mass of PM sampled above your limit of detection (LOD)? The answer should be yes.
If the mass of PM accumulated on the sample filter is not above the LOD, your measurement won't be very reliable. Read this post to learn more about how to determine the LOD for your study. If you find that a large proportion of your sample masses are below your LOD, you will need to increase the volume of air sampled by reducing the duty cycle, increasing the sample duration, and/or increasing the sample flow rate. To accomplish the latter, you will need to use a different size-selective inlet that is designed to operate at a higher sample flow rate; for example, if you are using our 1 L min-1 PM2.5 inlet, you could switch to our 2 L min-1 PM2.5 inlet.
Did you collect too much particulate matter?
Was the sample filter overloaded? The answer should be no.
When we say that a sample is "overloaded," we mean that there is too much PM on the filter. You should check each sample to confirm that it does not appear overloaded before accepting it. Overloading can take two different forms:
-
In the first form, so much PM accumulates on the filter that it becomes clogged and the sample pump can no longer pull air through the filter at the target flow rate. If this first form of overloading occurs, it will most likely be detected by the QA checks that you perform on the sample duration and flow rate.
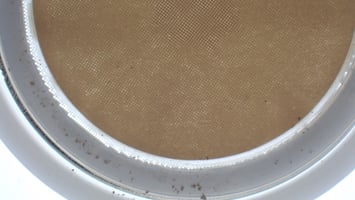
- In the second form, the size-selective inlet becomes overwhelmed and allows particles that are too large to reach the sample filter. You should perform at least a simple visual inspection on each filter sample that you collect to look for large, loose particles on the filter.
Read this post for more advice on how to identify and address overloading problems.
Optional: How did the sample-averaged filter-derived and sensor-reported PM2.5 concentrations compare?
If you: (a) collected a PM2.5 sample using the UPAS v2.1 PLUS (which contains a Sensirion SPS30 PM sensor) or (b) collocated your UPAS with another instrument that contains a low-cost optical PM sensor, you can compare the PM2.5 concentration that you measured using the filter sample to the PM2.5 concentration reported by the sensor to look for signs that something might be wrong with your measurements.
To complete this check:
-
Calculate the PM2.5 concentration measured using the filter sample, in μg m-3, by dividing the mass of PM2.5 accumulated on the filter (in μg) by the volume of air sampled through the filter (in m3). Note that you will need to divide the "SampledVolume" parameter from the SAMPLE SUMMARY section of the log file header by 1000 to convert the value from L to m3.
- Calculate the time-averaged PM2.5 concentration reported by the Sensirion SPS30 sensor by averaging the "PM2_5MC" values in the SAMPLE LOG over the duration of the filter sample. The "PM2_5MC" values are written to the log file in units of μg m-3, so you do not need to make any unit conversions during this step.
- Divide the PM2.5 concentration measured using the filter sample (which you calculated during Step 1) by the time-averaged PM2.5 concentration reported by the sensor (which you calculated during Step 2). We'll refer to this result as your "filter/sensor PM2.5 ratio."
- Check to see whether the filter/sensor PM2.5 ratio calculated during Step 3 falls within your expected range.
Note that the PM2.5 concentration measured using the filter sample will most likely differ from the time-averaged PM2.5 concentration measured using a collocated optical PM sensor because the sizes, shapes, and refractive indices of the particles in the aerosol sampled onto the filter will most likely differ from the sizes, shapes, and refractive indices of the particles in the aerosol that was used to calibrate the sensor. In other words, the filter/sensor PM2.5 ratio calculated during Step 3 above will most likely not equal one.
So, what is the expected range of filter/sensor PM2.5 ratios? Generally, ratios between 0.4 and 3 are common.
More specifically, Li et al. (2025) found that filter/sensor PM2.5 ratios between 0.4 and 3 were most common for 24-hour personal and in-home samples collected with adults living in California's Central Valley between 2022 and 2024, but also calculated filter/sensor PM2.5 ratios as high as 6.75 for samples that had met a rigorous set of quality assurance criteria.
If you check the filter/sensor PM2.5 ratio as part of your sample quality assurance process, keep in mind that, low-cost optical PM sensors—like the Sensirion SPS30 included in the UPAS v2.1 PLUS and the Plantower PMS5003 included in the PurpleAir—are especially likely to underestimate PM2.5 concentrations in dusty environments where the mass median diameter of the aerosol is larger (Molina Rueda et al., 2023; Jaffe et al., 2023; Ouimette et al., 2024). You should expect to find filter/sensor PM2.5 ratios >1 in such settings.