Unfortunately, not every particulate matter (PM) sample that you attempt to collect will be...
What does it mean for a sample to be "overloaded"?
When a sample is said to be "overloaded," that generally means "too much particulate matter was sampled onto the filter." The following are examples of different types of overloading problems:
- The sample filter can become so heavily loaded with particulate matter (PM) that the pump can no longer pull air through the filter at the target volumetric flow rate. As a result, the sample might end before the intended sample duration is reached, thus making it difficult or impossible to compare that sample to others from the study or to a specific time-based air quality guideline.
- The sample filter can become so heavily loaded that it can't hold all the collected PM. As a result, some of the PM might fall off the filter during normal handling, and it won't be possible to get a reliable measurement of how much PM mass was in the sample originally. In the absence of any other overloading problems, the resulting measurement will be an underestimate of the time-averaged mass concentration in the PM size fraction of interest.
- The size-selective inlet can become saturated with particles larger than the intended cutoff size and those large particles can "break through" to the filter. As a result, the sample will no longer reflect the intended particle size fraction (e.g., PM2.5); instead, the filter will contain particles that span some other, unknown, size range. In this case, the resulting measurement will be an overestimate of the time-averaged mass concentration in the PM size fraction of interest.
In the case of the first or second problem listed above, the sample collected on the filter might still reflect the intended PM size fraction; however, in any of these three cases, the bottom line is the same: It can be difficult or impossible to obtain a reliable measurement of the mass concentration in the PM size fraction of interest from an overloaded sample. Below, we'll talk about steps you can take to try to identify and address overloading issues.
Wait! Those things can happen?
Unfortunately, yes, all of the overloading problems listed above can happen with any PM sampling system—not just with products sold by Access Sensor Technologies. The prevalence of these issues will be influenced by your unique sampling environment but, in general, they are more likely to occur in dustier environments, in more polluted environments, and with longer samples. Additionally, different inlets and samplers might have different design features that make them more resistant to these problems. Below, we'll talk about steps you can take to try to identify overloading problems, if they occur, and avoid them. We recommend establishing a quality assurance protocol to look out for overloading when using any instrument(s) in any sampling campaign—even if you decide that our air samplers are not the best-suited for your application.
How will I know if my sample was overloaded?
There are a few simple sample quality assurance steps that you can take to look for overloading. When possible, it's best to perform quality assurance checks on your samples as you collect them—and not just at the end of your sampling campaign—so that you can adjust your sampling plan if you identify problems.
Check the sample flow rate and duration
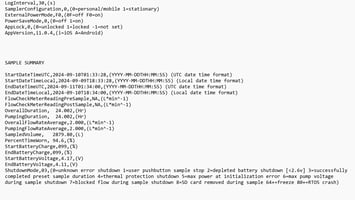
After each sample, check the data in the log file to confirm that the sampler was able to maintain the target volumetric flow rate for the full duration of the sample (see Table 1 and Figure 1). The following could be signs that the sample became overloaded:
- The sample-averaged volumetric flow rate was more than 5% below the target value.
- The time-resolved volumetric flow rate decreased below the target value towards the end of the sample.
- The sample ended before the desired sample duration was reached.
- For a sample collected with the UPAS, the shutdown mode was indicated as 6 or 7 in the log file header.
Note, however, that the above phenomena do not always indicate that the sample became overloaded and could indicate different problem. For example, the sample could have ended earlier than the pre-programmed duration because the battery in the sampler died. Additionally, a UPAS shutdown mode of 6 or 7 could have been triggered because the inlet was blocked by a physical obstruction, such as a piece of non-breathable fabric.
Table 1. Parameter(s) from the UPAS log file that indicate the sample-averaged and time-resolved sample volumetric flow rates (in L min-1). See the log file legend in the user guide for your specific UPAS model for more information on the meaning of each parameter.
| UPAS model | Firmware version | Parameter in the SAMPLE SUMMARY section of the header that indicates the sample-averaged volumetric flow rate when the pumps were on | Parameter in the SAMPLE LOG that indicates time-resolved sample volumetric flow rate when the pumps were on |
| v2.0 | ≥100 | AverageVolumetricFlowRate | VolumetricFlowRate |
| v2.1 or v2.1 PLUS | ≤158 | PumpingFlowRateAverage | PumpingFlowRate |
| v2.1 or v2.1 PLUS | ≥200 | PumpingFlowAvgFactory or PumpingFlowAvgOffset | PumpingFlowFactory or PumpingFlowOffset |
You can plot the sample volumetric flow rate over time using the "Interactive Plot" tab in our shinyAST application. An example is shown in Figure 1.
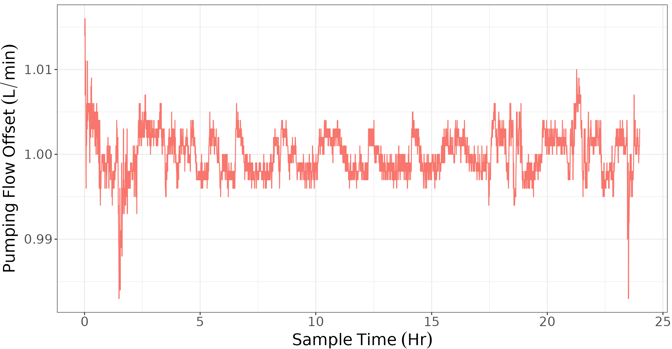
Figure 1. A graph of a UPAS filter sample volumetric flow rate over the duration of a 24-h sample. This graph was created using the "Interactive Plot" tab in the shinyAST application. In this example, the sample volumetric flow rate remained at the target value of 1 L min-1 ± 4% over the full duration of the sample.
Visually inspect the sample filter
Visually inspect every sample filter for the signs of overloading shown in Figure 2:
- Bare spots where a portion of the sample has fallen off the filter (which indicates the 2nd problem listed at the start of this post),
- Large particles or agglomerates that are visible with the naked eye (which indicates the 3rd problem at the start of this post), or
- Loose dust on the filter support ring (which also indicates the 3rd problem at the start of this post).
 |
 |
 |
| (a) Bare spots where a portion of the sample has fallen off the filter | (b) Large individual particles that are visible with the naked eye | (c) Loose dust in the filter cartridge and on the support ring |
Figure 2. Indicators of overloading that can be identified through visual inspection of each particulate matter sample filter.
Note that the example filters shown in Figure 2 were intentionally overloaded (by sampling Arizona road dust from the inside of a sand blasting cabinet) and were not "real-world" samples. Examples (a) and (b) in Figure 2 were collected using a UPAS with Access Sensor Technologies' GEN2 1 LPM PM2.5 inlet whereas example (c) was collected with a personal sampling PM2.5 inlet sold by a different manufacturer.
Compare to optical PM sensor data
If you are collecting samples with the UPAS v2.1 PLUS, you can compare the sample-averaged PM2.5 concentration derived from the filter sample (in µg m-3) to the sample-averaged PM2.5 concentration reported by the optical sensor (i.e., PM2_5MC from the sample log averaged over the duration of the filter sample). If the ratio of the PM2.5 concentration derived from the filter sample to the sample-averaged PM2.5 concentration reported by the optical sensor is unusually high, you might suspect that the filter sample suffers from the 3rd overloading problem listed at the start of this post.
Keep in mind, though, that low-cost optical PM sensors—like the Sensirion SPS30 included in the UPAS v2.1 PLUS and the Plantower PMS5003 included in the PurpleAir—are especially likely to underestimate PM2.5 concentrations in dusty environments where the mass median diameter of the aerosol is larger (Molina Rueda et al., 2023; Jaffe et al., 2023; Ouimette et al., 2024). These same dusty environments might also make the 3rd sample overloading problem listed at the start of this post more likely. As a result, a relatively wide range of filter/sensor PM2.5 ratios should be expected. So, what would constitute an "unusually high" filter/sensor PM2.5 ratio?
Li et al. found that filter/sensor PM2.5 ratios between 0.4 and 3 were common for personal and in-home samples collected with adults living in California's Central Valley between 2022 and 2024. Additionally, several samples had filter/sensor PM2.5 ratios between 3 and 4.5, and the highest filter/sensor PM2.5 ratio for a personal sample was 6.75. We are confident that these ratios did not reflect overloaded filter samples for two reasons. Firstly, each UPAS PM2.5 sample was collocated with a PM2.5 sample collected using a Personal Modular Impactor connected to a Casella Apex2 Pro pump and both samplers measured similar 24-h average PM2.5 concentrations. Secondly, all filter samples were screened by: (a) checking the sample flow rate over the sample duration and (b) visually inspecting each filter. No UPAS PM2.5 samples had unusual sample flow rates nor obvious visual signs of overloading.
Jaffe et al. found that the PMS5003 sensor included in the PurpleAir underestimated 24-h average ambient PM2.5 concentrations, relative to an US EPA-approved regulatory monitor, by a factor of 3.5 to 4.5 during a dust pollution event in the southeastern United States. The PMS5003 is a different sensor model than the SPS30 included in the UPAS v2.1 PLUS, but both operate using similar physical principles and therefore suffer from similar limitations. Furthermore, the SPS30 was found to report lower urban ambient PM2.5 concentrations than the PMS5003 in a study conducted in Fort Collins, Colorado, USA. Taking the results from these two studies together, we would also expect the SPS30 to also underestimate 24-h average PM2.5 concentrations associated with dust pollution by a factor of up to 4.5.
Overall, sample-averaged filter/sensor PM2.5 ratios between 0.4 and 3 are common for 24-hour samples. In dusty environments, ratios as high as 5 can be expected and do not necessarily indicate that the filter sample is overloaded with particles > 2.5 μm in aerodynamic diameter.
How can I reduce the likelihood of overloading?
If your samples suffer from the 1st and/or 2nd problem(s) outlined at the start of this post, the only way to reduce the likelihood of overloading in future samples collected from the same environment is to sample less air (and therefore less PM). Specific approaches to sampling less air are as follows:
- Reduce the sample duration: You can reduce the amount of PM sampled by reducing the duration of your sample. This approach might not be feasible if you need to measure human exposure to PM over a specific time or during an activity that lasts for a specific duration.
- Duty cycle the sampling pump: "Duty cycling" refers to the practice of cycling the sample pump on and off at regular, short-duration intervals throughout the sample to reduce both the pump runtime and the total volume of air sampled. Read this blog post to learn more about how to operate the UPAS on a duty cycle.
- Reduce the sample flow rate: You can reduce the amount of PM sampled by reducing the sample flow rate; however, you cannot reduce the sample flow rate arbitrarily. Size-selective PM inlets are designed to operate at a specific volumetric flow rate and must be operated at that flow rate. Sometimes, though, it's possible to switch to an inlet that is designed to operate at a lower flow rate. If you are using our PM2.5 inlet that's designed to operate at 2 L min-1 but find that many of your samples are overloaded, you can switch to our PM2.5 inlet that's designed to operate at 1 L min-1. Learn more about the different size-selective inlets that are available for Access Sensor Technologies air samplers on our Inlets and Accessories page.
If your samples suffer from the 3rd problem outlined at the start of this post, sampling less air might help; however, you also have another option: If you are using our GEN2 1 LPM PM2.5 inlet, you can make that inlet more resistant to overloading and large-particle breakthrough by installing our pre-cyclone impactor in the inlet cap. The pre-cyclone impactor is designed to remove particles with aerodynamic diameters larger than ~5.4 µm from the sample air upstream of the PM2.5 cyclone. Read this blog post to learn more about the pre-cyclone impactor. This approach might not be applicable if the air you are sampling contains a lot of very small PM (e.g., biomass smoke, diesel soot, salt aerosol from a humidifier) that is overloading and clogging the filter but very few large particles that could overwhelm and break through the inlet; however, the pre-cyclone impactor might be especially helpful in sampling environments where dust, ash, and fibers are prevalent.